Most people assume building a serious sports app means spending serious money.
Enterprise data contracts. Corporate API agreements. A budget that only makes sense if you’re already funded.
That assumption almost killed this project before it started.
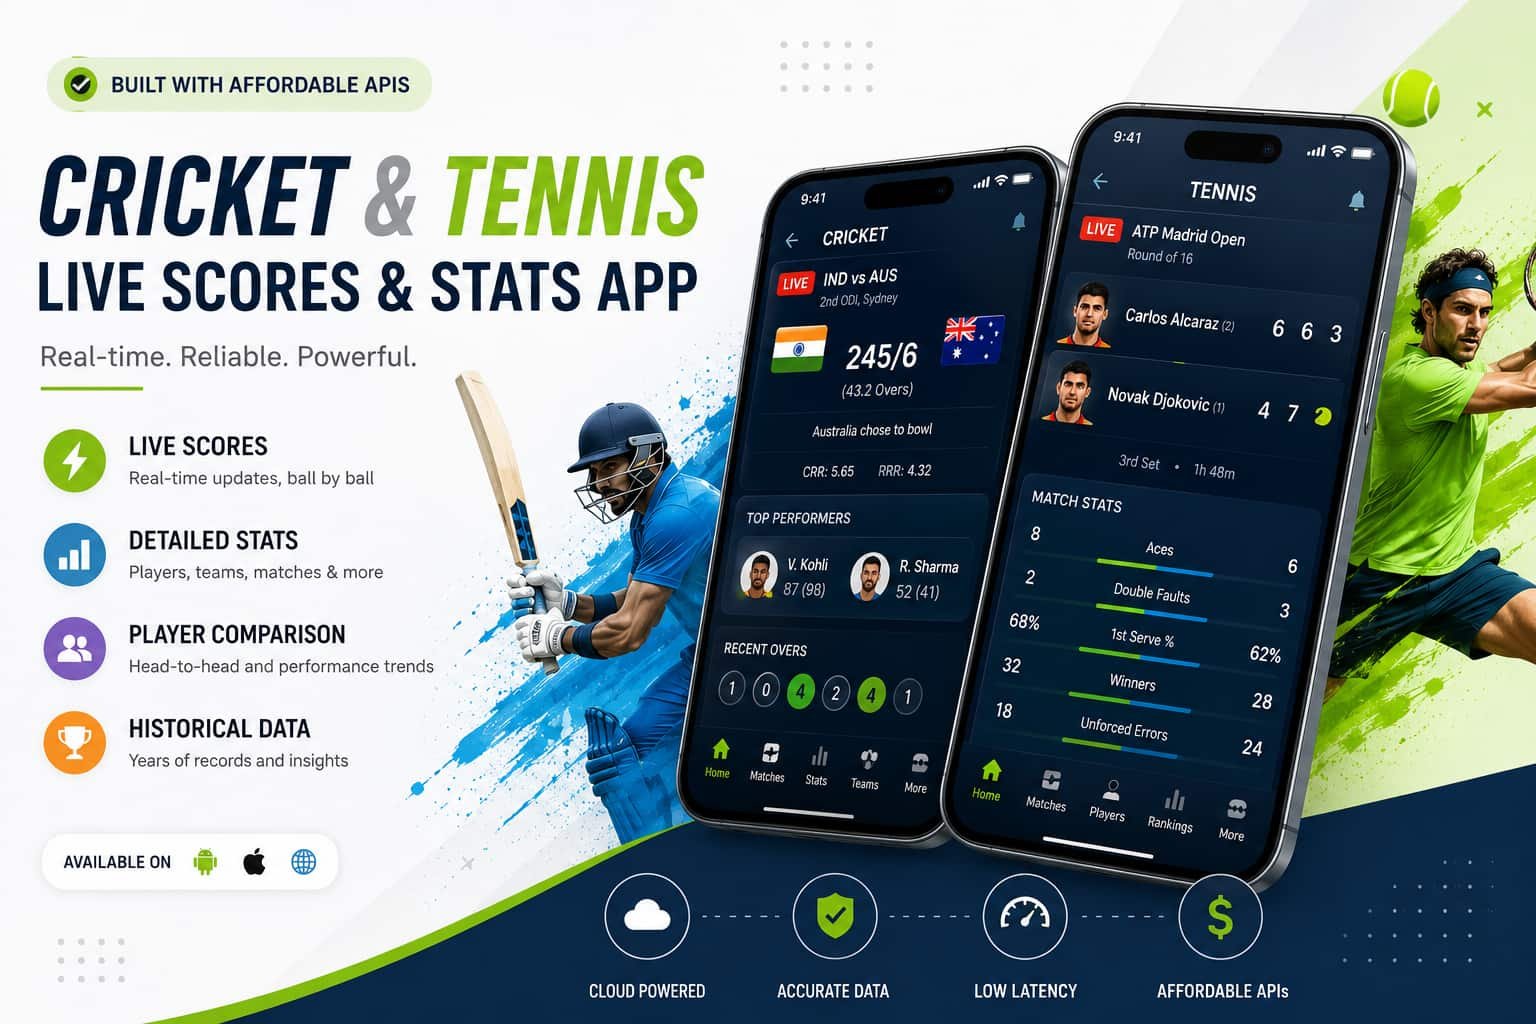
I wanted to build one platform that handled both cricket and tennis — live scores, player stats, historical records, rankings, head-to-head breakdowns, the works.
Not a score widget. An actual product where a fan could land and stay.
How to Build a Premium Cricket and Tennis Live Scores & Stats App Using Affordable APIs?
The data problem looked expensive until I started digging.
Why Sports Data Costs Less Than You Think?
After going through dozens of providers, I found that affordable APIs now cover the same ground that used to require enterprise contracts.
This guide on the best tennis data APIs for statistics and analytics was one of the first resources that made that clear — professional-grade tennis data is now genuinely accessible to independent developers.
The Tennis API ATP/WTA/ITF on RapidAPI was the specific find that changed my approach.
Full ATP, WTA, Challenger, and ITF coverage at a price point that made sense for a startup.
That’s not a compromise product — that’s the same data depth that sportsbooks use, just priced for builders who aren’t sportsbooks.
The Problem I Was Actually Trying to Solve
Tennis information is scattered everywhere. Rankings on one site. Head-to-head records on another. Live scores on a third. Historical results somewhere else entirely.
Cricket is the same story, but worse — the format complexity (Tests, ODIs, T20s) means data is spread across even more specialist sources.
I wanted one place that gave users:
- Live scores across both sports
- Player and team statistics with actual depth
- Historical results going back years, not weeks
- Head-to-head comparisons with surface and format filters
- Rankings and tournament data updated in real time
- Performance trends over a season or a career
The product vision was clear. The question was whether the data could support it without breaking the budget.
Why Tennis Came First?
Tennis is unusually data-rich for an individual sport.
Every match generates dozens of meaningful statistics, and fans actively want to analyse them.
A live score tells you the result. A historical database tells you whether that result was a surprise.
The gap between those two things is where most sports apps fall short — and where this one had a chance to be genuinely useful.
Users wanted:
- Surface-by-surface win rates
- Head-to-head history broken down by tournament type
- Career records against top-10 opponents
- Ranking movement over time
None of that requires expensive data. It requires the right data and a UI that makes it easy to explore.
Building Features That Feel Premium Without Premium Costs
The features users actually come back for aren’t the hardest ones to build. They’re the most thoughtfully presented.
- Player comparison pages — Pick two players, filter by surface, and see who has the edge on clay vs hard courts. Simple to build once the data is there.
- Head-to-head analysis — Not just win/loss. Last five meetings, average sets played, and on which surface they’ve met most.
- Recent form tracking — A rolling window of results, filterable by tournament tier.
- Ranking movement — Where a player was six months ago versus today, visualised simply.
These features drove more return visits than the live scores did. Users checked live scores to watch a match.
They came back to the stats pages because they were genuinely interesting to browse.
Adding Cricket
Once tennis was stable, cricket was the obvious expansion.
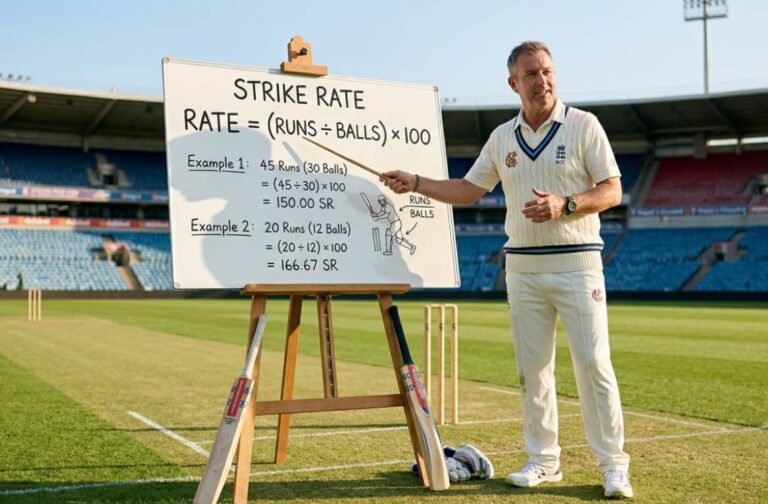
Cricket fans are among the most statistically engaged sports audiences anywhere — they track averages obsessively, argue about strike rates, and remember scorecards from matches played decades ago.
The technical complexity was higher than in tennis.
Cricket data involves:
- Multiple match formats (Test, ODI, T20, T10)
- Innings structures and partnership records
- Bowling figures broken down by phase of play
- Venue-specific performance data
- Team records against specific opponents
The data structures were more complex, but the same principle held: find reliable APIs, build a clean interface around them, and let the data do the work.
The Lesson About Historical Data
I assumed live scores would be the main draw.
They drive initial traffic — people search for a match, find the score, and land on the site.
But historical data drives engagement. Users who found the platform through a live score started exploring:
- Past meetings between players or teams
- Career records in different formats
- Performance at specific venues
- Season-by-season stat comparisons
The deeper the historical coverage, the longer users stayed.
That changed how I prioritised the API evaluation — historical depth became as important as live data accuracy.
Evaluating APIs: What Actually Matters?
When comparing providers, I focused on four things:
| Factor | Why It Matters |
|---|---|
| Historical depth | Anything under 5 years is too shallow for head-to-head features |
| Update frequency | Live scores need to be near real-time; stats can lag slightly |
| Data completeness | Missing matches in a career record breaks user trust immediately |
| Endpoint structure | Clean, logical endpoints save weeks of integration work |
Pricing matters, but it’s rarely the deciding factor at the indie developer level.
An API that’s 20% cheaper but has patchy historical data will cost you far more in user trust.
What I Got Wrong Early On?
A few things I’d change if starting over:
- I underestimated how much users care about data gaps. One missing tournament in a player’s record gets noticed. Sports fans know the data they’re checking.
- I over-invested in the live score UI before validating the analytics features. The analytics pages turned out to be what differentiated the product. I should have built those first.
- I didn’t spend enough time on API evaluation before writing code. The data layer determines what the product can become. Changing APIs halfway through is painful.
FAQs
- Do I need an enterprise contract to access quality sports data?
No. Several providers on RapidAPI offer professional-grade ATP, WTA, and cricket data at pricing that works for independent developers and small startups.
- Which features drive the most user engagement on sports stats platforms?
Historical data, head-to-head comparisons, and player trend pages consistently outperform live scores on session length and return visit rate.
- How do I handle cricket’s multi-format complexity in a single app?
Structure your data layer with a format as a primary filter from the start. Mixing Test and T20 stats in the same queries creates problems that are hard to fix later.
- What’s the minimum historical depth needed for a useful cricket or tennis stats platform?
For tennis, five years of results give you enough for meaningful head-to-head and surface analysis. For cricket, deeper is always better — fans reference series from 10+ years ago regularly.
- Can a single developer build and maintain a platform covering both sports?
Yes, if the API layer is solid. Most of the maintenance overhead is data pipeline work. Good APIs reduce that significantly.
Conclusion:
Building this taught me one clear lesson: the product ceiling is set by the data, not the interface.
A mediocre UI on top of good data beats a beautiful interface on top of incomplete data, every time.
The affordable API market is good enough now that the data ceiling is higher than most independent developers realise.
That’s worth knowing before you assume the project is out of reach.